Over the past decade, during CCCC’s involvement in resolving 600 business problems for many companies, a common manifestation of the business improvement process occurred. Despite the fact that the problem solving covered a wide range issues in production, marketing, finance, human resources, conflict, etc. the ‘common manifestation’ was that sales increased by about 30% per annum. This sales climb occurred repeatedly with clients even though sales concerns were not the main issues addressed. So what gives?
2. The Improvements
Out of that experience, among the most frequently encountered problems that companies have faced, and
continue to face, are (alphabetically listed):
• Authority is not clear.
• Commitments are made that company cannot deliver.
• Company has lost touch with clients and markets.
• Delegation to staff is lacking.
• Fun in the workplace is no longer the norm.
• Budgets are not met.
• Management is too ambiguous on what it wants
from subordinates.
• Managerial styles of some key individuals are inappropriate.
• Meetings are boring and wasteful.
• Teamwork is inadequate.
Next, among the problem hot list, are:
Backbiting, backstabbing, blaming and finding
scapegoats pervades.
• Bureaucracy grows.
• Communications laterally are inadequate.
• Customer complaints are frequent.
• Department revolves around one person.
• Departments are concerned primarily with themselves.
• Firings today are directed at those we should have
been fired last year.
• Headquarters support for the field operations is inadequate.
• Hiring today is for those we needed yesterday.
• Information received is too great or irrelevant.
• Mediocrity is accepted.
• Morale of employees is low.
• Old timers fight newcomers.
• Overspending is discovered too late.
• Parent company is suffocating our subsidiary.
• People are expected to agree–regardless of the
issue.
• Priorities are changed too frequently.
• Products and technology are outdated.
• Responsibilities are not clear.
• Rules are too numerous or are enforced too much • Sales department policies are dictated by Finance department.
• Too much organizing and administering, not enough doing.
• Too much conflict.
• Turnover of employees is high.
In the parade of pain above, only a few issues were allied to sales and marketing. That is, the majority of difficulties listed above lie outside of the sales and marketing domain.
3. Identify Some Ways to Help Your Enterprise Improve
Perhaps if you identify some of the items on the list above as occurring within your company, you could use that as a take-off point for helping your company start on its path to improvement and for making the main point or the hypothesis of this paper – namely a means to improve your sales. Just tick the relevant areas for you. If you wish to make the task more realistic, add the names of other issues that your company has that are not on the lists above.
However, in this paper, we will continue assuming typical problem distribution for the type of companies we have worked with.
4. Keep It Simple
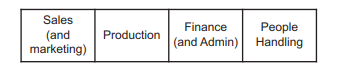
All organizations have the four primary functional areas of:
a. Sales (and marketing): connecting to the clients your company serves
b. Production: producing whatever your mandate asks you to provide
c. Financial: counting and distributing money in and money out
d. People Handling: looking after the people who comprise the organization.
No company, no organization, not even government can avoid activities within these four primary functions. In government, ‘sales and marketing’ clients would be the other departments or perhaps the public; they must be made aware of the program or service offered (marketing) and you must get their commitment to partake (sales) in those services.
5. Help the Company, You Know So Well, Improve
Now, continuing to use your company as the example to make our point, look at all the ‘weaknesses’ or issues you have identified above and allocate them to each of the four functional areas, a, b, c or d. In some cases the issue will span more than one of these four and in a few cases, it might span all four of them. Nevertheless, some result will occur. Add up the: a, b, c and d’s. Perhaps your outcome might look like:
– 1 a’s
– 4 b’s
– 6 c’s
– 2 d.
Every company is unique. Now let’s put some numbers to these. It has been our experience that an unresolved problem costs a company, on average, $50,000 a year. However, let’s keep the outcome more conservative in the case of your company, and suggest that each issue will average a cost of $10,000 per year. (Now, if you believe that $10,000 is an overstatement for your organization use $1000.) Using the $10,000 example above we will end up with:
-a: 1 x $10,000 = $10,000
-b: 4 x $10,000 = $40,000
-c: 6 x $10,000 = $60,000
-e: 2 x $10,000 = $20,000
$130,000
So we can now anticipate improvements in this example of $130,000 per year in the situation above.
6. A Practical Example
Experience shows over this past decade that the typical company has a backlog of issues in the ratio of one to two problems per employee; for a 100-person company that would be 100 to 200 issues to deal with. Although most companies think they have only a few issues, the unpleasant reality comes forward when a thorough analysis has been completed. Fortunately, the real magnitude of the work before the team quickly sinks in and they anxiously roll up their sleeves to get on with the task.
Let us shift to a graphic format so we can see what is happening. The four primary functions can be each represented by a box.
Now it is unlikely that all four domains are of equal importance in a company. The typical budget distribution might be as follows: 15% Finance, 15% People Handing, 20% Sales and 50% Production1, represented by the sketch below.
To make those real, imagine that your company has an annual budget of $10,000,000 (in fact your should insert your own company’s numbers in here). The size of each group’s budget would be $1,500,000 (Finance), $1,500,000 (People Handling), $2,000,000 (Sales) and $5,000,000 (Production), which would show proportionally in the sketch at the end of this paper.
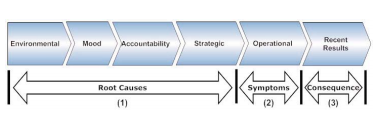
7. Problem Alignment
There is a problem alignment cause-and-effect chain shown in a sketch below: Problem 1 could be a root cause, problem 2 a symptom of that root cause and problem 3 a manifestation of it. For example, the issue of “turnover of employees is high” could be a manifestation (3) of a deep issue although everyone sees and thinks “turnover” is the problem. The symptom (2) might be a high rate of employee absenteeism and continual infighting. The operational root cause (1) might be the intolerable attitude or mood of a key manager. That is, there is a domino effect in not only causes of problems but in resolving them. If the dysfunctional key manager is dealt with (1), problems 2 and 3 might disappear on their own..
Fortunately the story gets better. The problem in department A often affects department B, even though department B has not identified the issue or its cause. It is almost as if an invisible hand by correcting one
issue in the shipping department reaches out to assist the marketing and sales department because improved shipping practices lead to happier customers. That is, every time a single problem is resolved it not only affects its own causality chain it benefits other parts of the company as well. This happens time and again3. (Perhaps it can be likened to the human body. Fix the pain in the finger and not only does the digit feel better but the headache also disappears.)
8. Getting Results
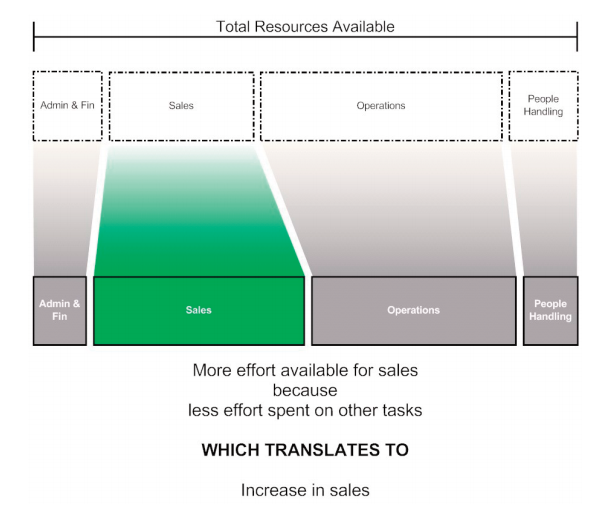
With problems allocated to the four primary functional areas in our typical company, and realizing an improvement of $10,000 or $50,000 per problem, we would end up with huge savings in the respective functional areas. Therefore we can now reduce the cost of each of the three departments by the problem-solving saving amounts above, so that Finance, People Handling and Production perform the same functions for hundreds of thousands of dollars less.
Obviously if there is a fixed budget and three of the four have been reduced, the fourth segment (Sales) has more budget at its disposal. Hence the chance of more effort being directed towards Sales is increased. The resulting sales budget trend is illustrated in the green portion of the sketch below. This, in fact, accounts for the increased Sales in most companies where problem improvements have been instituted. What are the exact numbers? Well every situation is different and the accuracy of any example can be easily questioned. But what
can’t be in question is the direction that these problems take us towards reducing costs significantly and those improved costs morphing into the company being able to spend more time on customer attention and sales-related activities.
For a non-profit company, such as a government, where Sales in the traditional definition or method do not exist, the amount of time spent with ‘clients’ or in ‘servicing the needs of clients’ will be increased.
The final results, as stated above, is that most companies who pass through such improvement programs see a dramatic increase in sales, averaging about 30% per annum as these problems are put to rest over a one or two-year time frame. As time progresses, sales increases hover around the 15% per annum mark, a very healthy growth rate that, compounded, will lead to a doubling of sales every five years.
You can do it too.
Good luck with your deeper approach towards sales development